Hi,
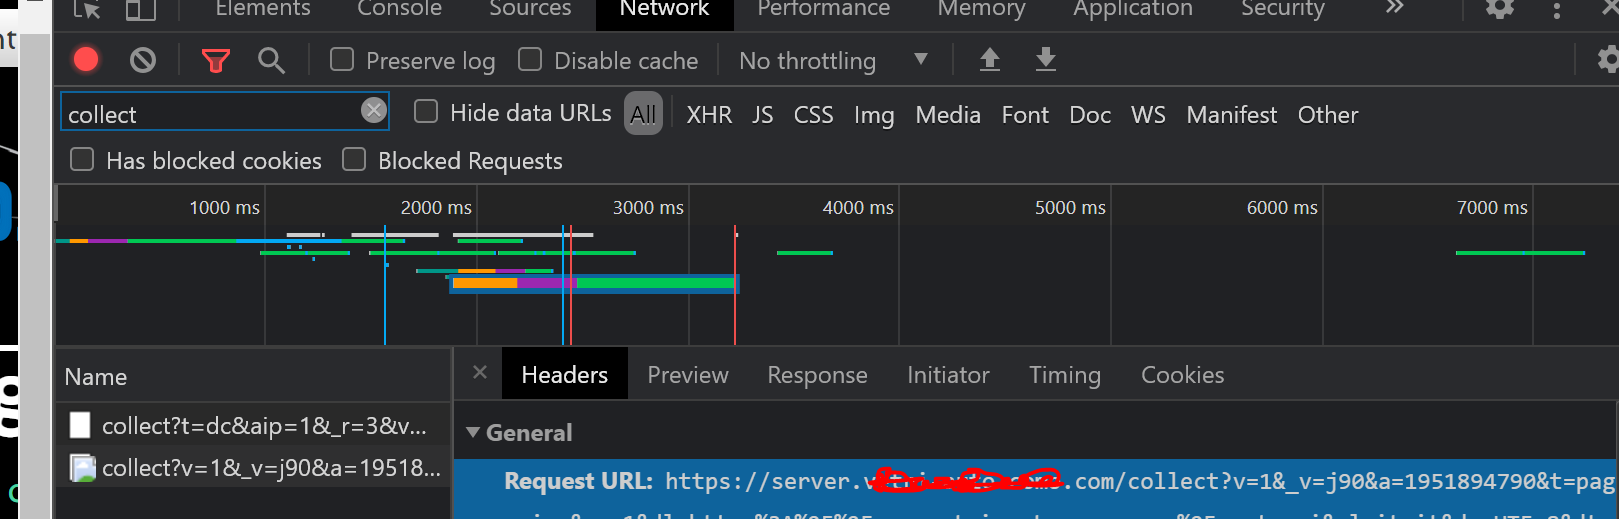
I’m able to see the request under the browser google consolle typing “collect” under the Network section but if I open the GTM debug under request section I don’t see nothing.
I’ve developed the site with Wix.com that develope single page application. Whit GTM web site I’m not able to see the pageview event (I simulate it wit the history trigger). Could be this the problem?
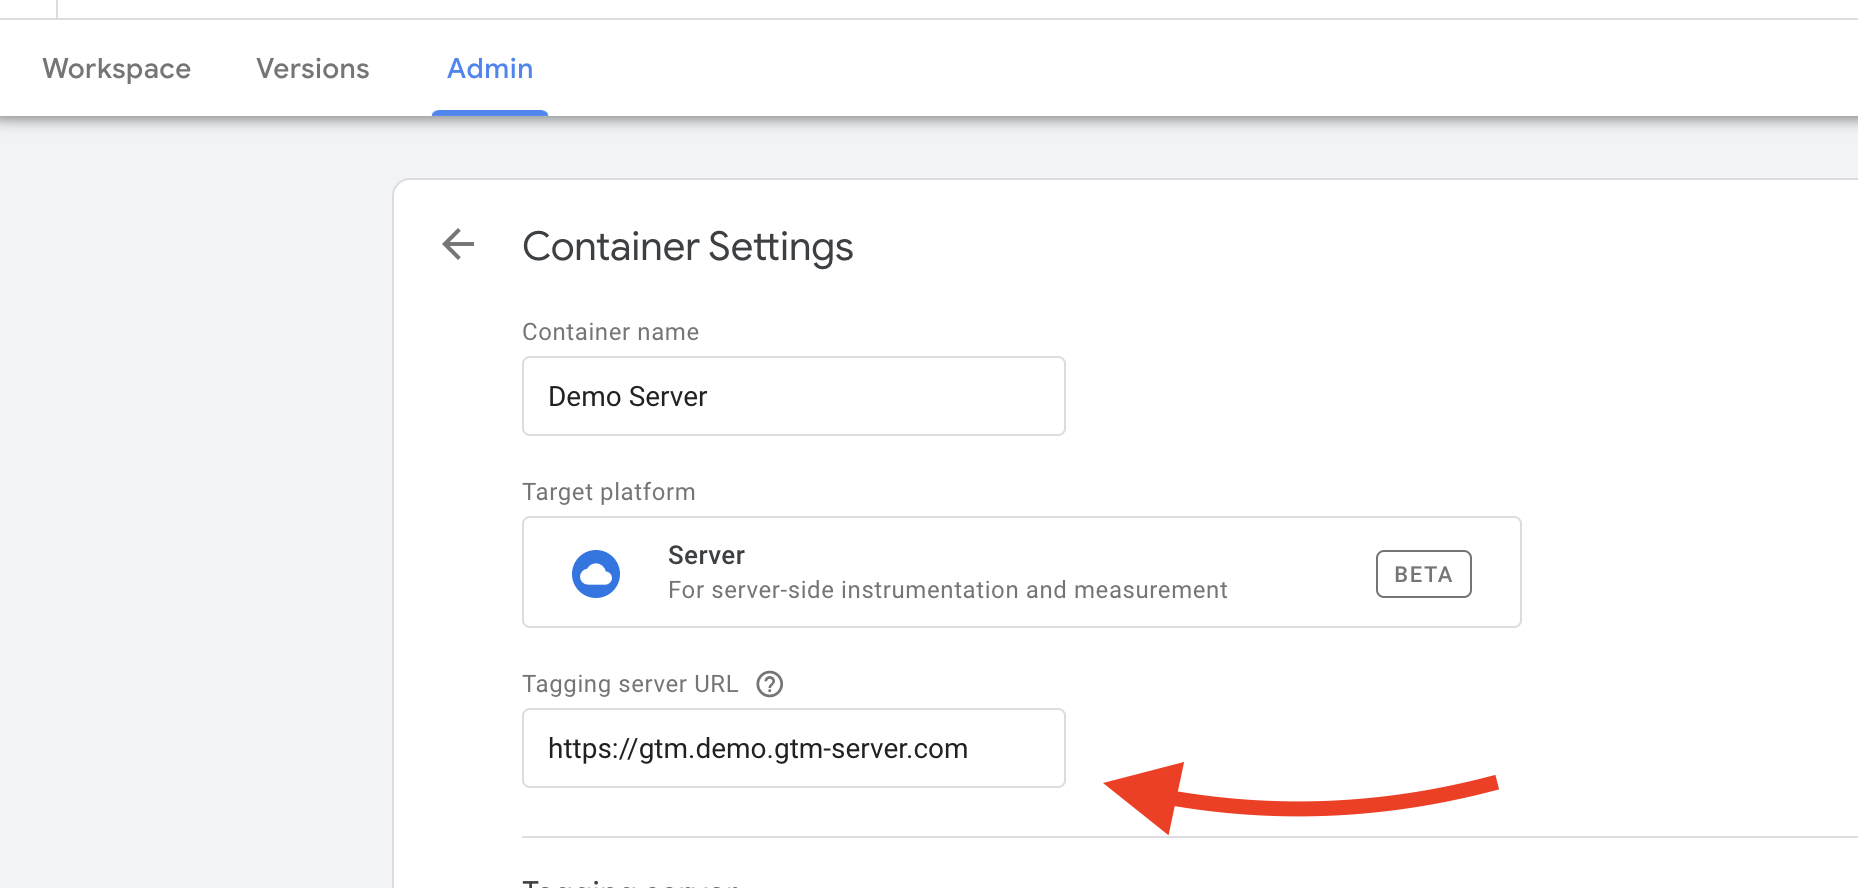
If I see the url request with the name of the Tagging server URL created in your service can I suppose that is all ok?
It doesn’t matter what CRM/platform or trigger in the GTM web container you use. All requests to GMT SS container with debug header or cookie have to be shown in the debugger.
Hi Denis,
Yesterday, before writing my post on this topic I had just finished configuring everything.
This morning it seems that everything works (debug mode records page views practically live and the real time of analytics, as it happened yesterday, tracks the sessions correctly).
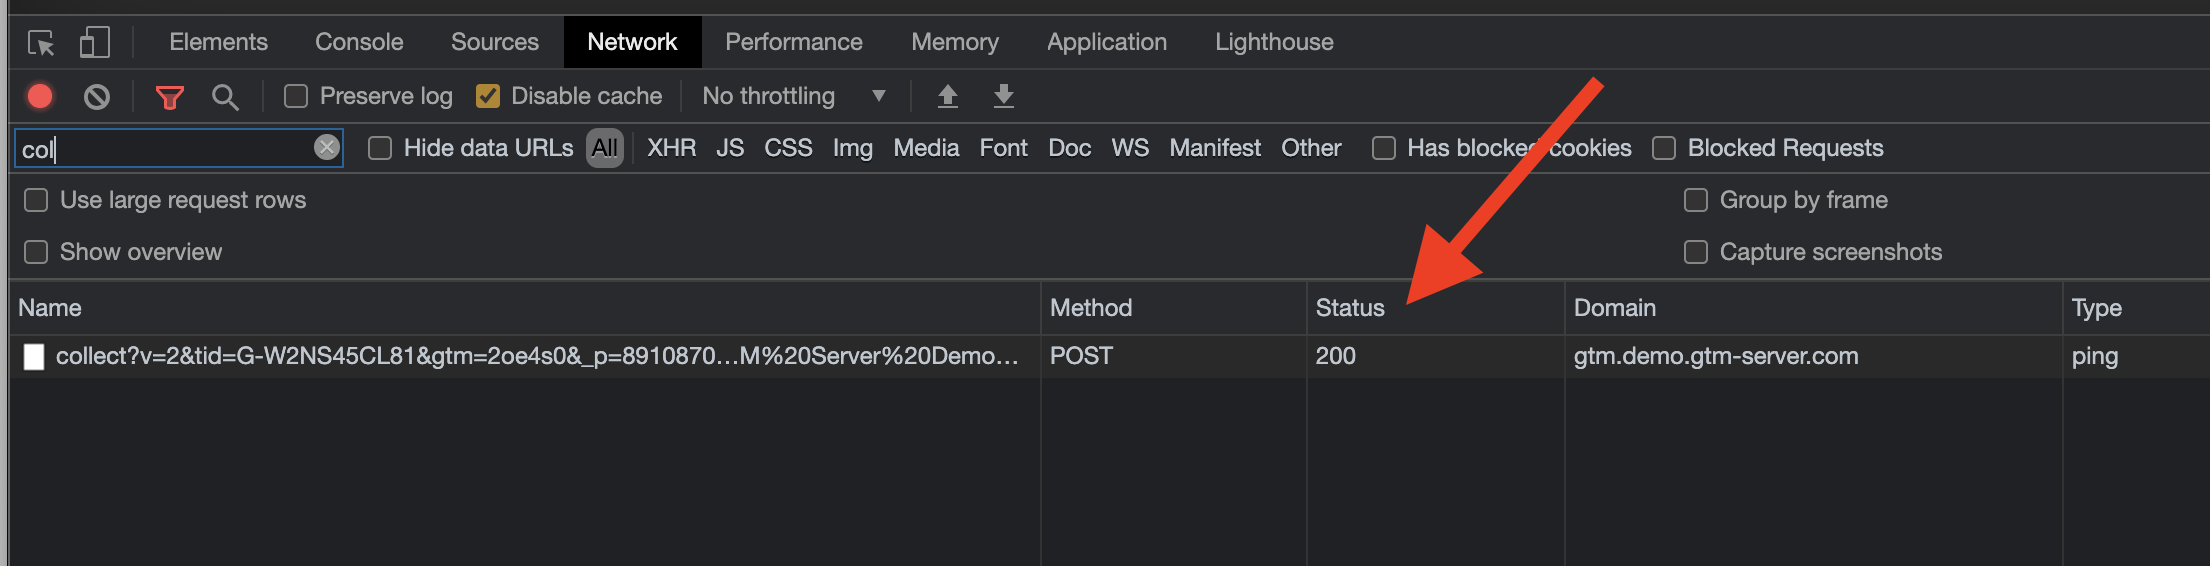
Although I am now quite certain that thanks to your guide I was able to set up a gtm server side container, I can ask you what you meant by "If your requests get a response with code in the range 200 - 310, it means that the setup is correct. "
By 200 - 310 did you mean that if the request is performed within 200 - 310 milliseconds the setup is considered correct?